![]()
Exemples
Lister les jeux de données
library("eurostat")

tocestat <- eurostat::get_eurostat_toc(lang = "fr")

tocestat |>
    DT::datatable()
#> Warning in instance$preRenderHook(instance): It seems your data is too big for
#> client-side DataTables. You may consider server-side processing:
#> https://rstudio.github.io/DT/server.htmlChercher des données par thème
entdataset <-
    eurostat::search_eurostat(pattern = "entreprises",
                                                        column = "title",
                                                        lang = "fr")

entdataset |>
    DT::datatable()
Télécharger des données
demoentr <-
eurostat::get_eurostat(
"bd_size",
filters = list(geo = c("EU27_2020", "FR", "IT", "DE", "ES"),
indic_sbs = "ENT_NR",
nace_r2 = "C",
sizeclas = "TOTAL"),
time_period = "2021",
time_format = "date")
#> Table bd_size cached at /tmp/RtmpwK89gk/eurostat/9e9d8d744aafac249e26c2114172f62d.rds
demoentrlab <-
demoentr |>
eurostat::label_eurostat(lang = "fr")
demoentrlab |>
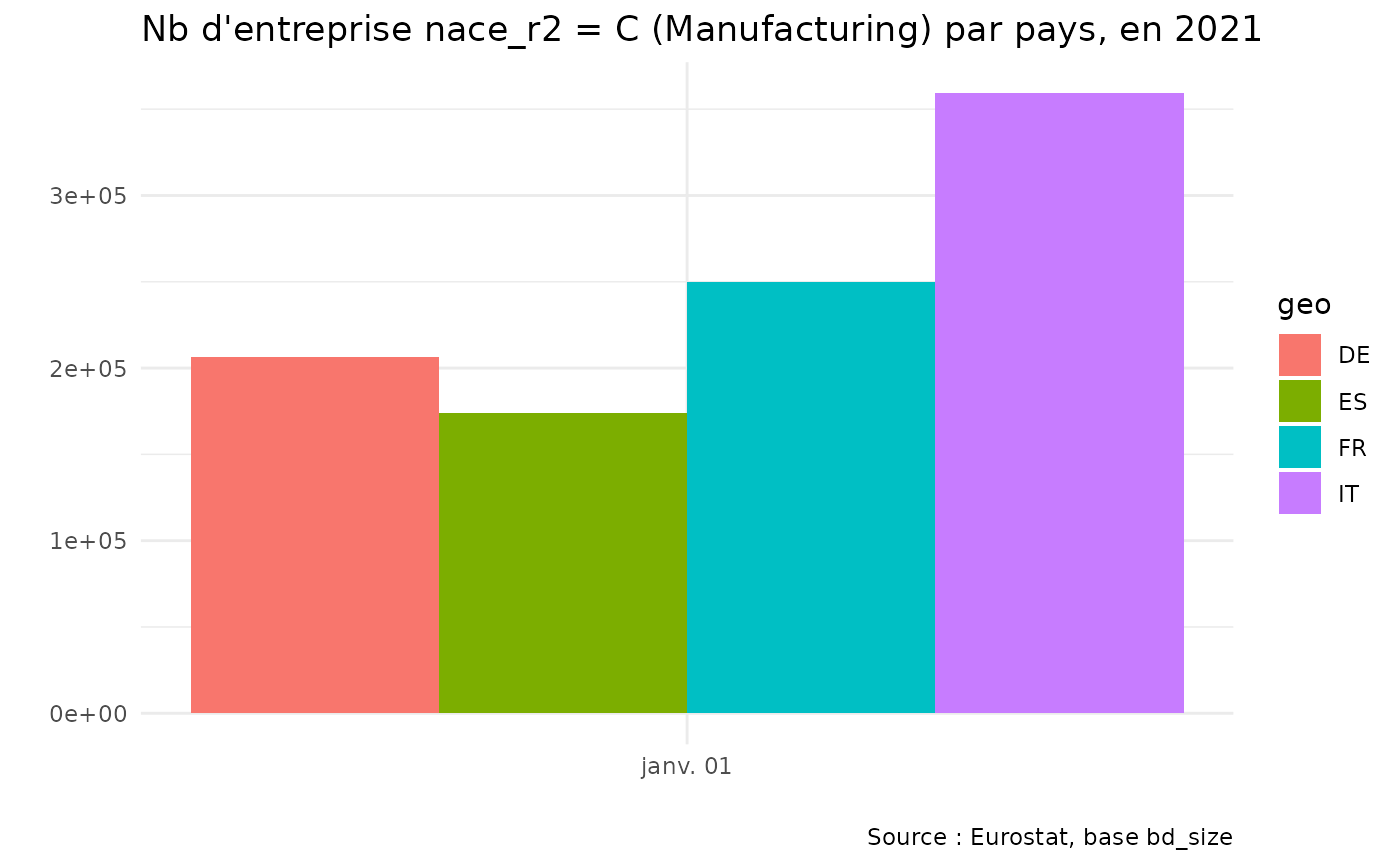
DT::datatable()Tracer
library("ggplot2")

demoentr |>
    dplyr::filter(time == "2021-01-01",
                                age == "TOTAL",
                                geo != "EU27_2020") |>
    ggplot(aes(x = time, y = values, fill = geo)) +
    geom_bar(stat = "identity", position = "dodge") +
    labs(x = "", y = "",
             caption = "Source : Eurostat, base bd_size",
             title = "Nb d'entreprise nace_r2 = C (Manufacturing) par pays, en 2021") +
    theme_minimal()